-
Solutions

Timesheets Management
Stop leaving money on the table. Procxo's AI integrated time tracking operates in the background.
Project Management
Procxo connects all the work your team does with the money your firm makes. Manage your deadlines, assignments, and budgets.
Invoice Management
Turn days of manual reconciliation into a single click. Procxo works in the background to automatically.
Contract Lifecycle Management
Accelerate negotiations, govern service level agreements (SLAs), and execute agreements flawlessly. Procxo unifies drafting.
-
Resources
Blogs
Read our latest insights, articles, and updates. Stay informed with industry trends and perspectives.
Case Studies
Explore real examples of our work and impact. See how we solve complex challenges.
Why Procxo
Built to streamline projects, billing, and financial workflows. Helping service professionals work smarter and grow faster.
FAQs
Browse answers to frequently asked questions. Find clear information about our services and processes.


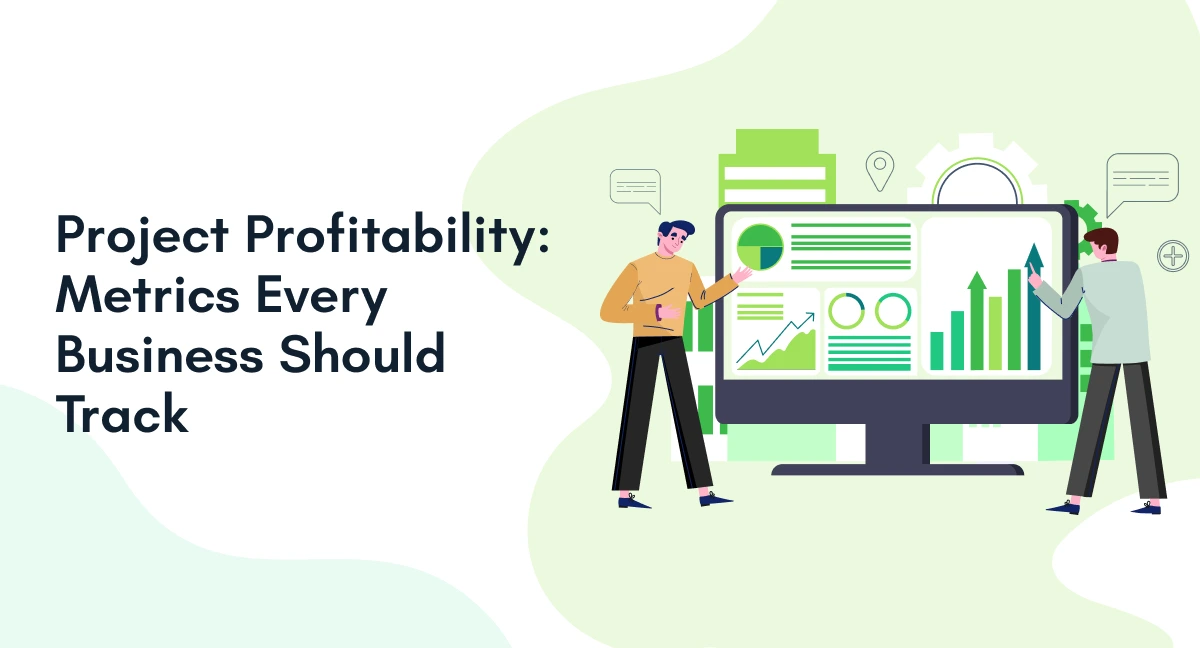
Revenue alone cannot show whether a project made money. A project may meet its revenue target and lose its margin. Extra hours, poor staffing, and scope changes can cause this. That makes project profitability an operating concern, not just a finance. Strong project profitability requires visibility into costs, hours, resources, and billing. It also requires regular profitability analysis during delivery.
This helps teams spot weak project margins before completion. It also gives leaders better control over project finance. Recent industry research highlights this visibility gap. According to teamwork, only 48% of agencies report strong confidence in profitability metrics. The issue is often not missing data. It is disconnected data across project and finance systems.

What does project profitability measure?
Project profitability measures the financial return from completed project work. It compares project revenue against its delivery costs. The basic calculation is simple:
Project Profit = Project Revenue − Total Project Costs
Project Profit Margin = Project Profit ÷ Project Revenue × 100
Project costs can include several components.
| Cost Area | What It Includes |
| Labor | Employee and contractor delivery costs |
| Resources | Cost of assigned project resources |
| Expenses | Travel, tools, materials, and other expenses |
| Overhead | Allocated business and operational costs |
| Unbilled work | Delivery time without corresponding revenue |
This calculation forms the foundation of profitability analysis. However, one final calculation cannot explain margin erosion. Teams need ongoing visibility throughout delivery. That is where project margins become useful. Margins show whether project economics are improving or declining. They also make project finance easier to monitor. Leaders can compare planned costs against actual costs. They can then act before losses become difficult to recover.
Which metrics reveal project profitability before it falls?
The most useful metrics connect financial results with delivery activity. They should show what has changed and why.
Gross project margin
Gross margin shows profit after direct delivery costs.
Gross Margin = Revenue − Direct Costs ÷ Revenue × 100
A falling margin can point to several issues. Teams may be spending more hours than planned. They may also use higher-cost resources than expected. Tracking project margins helps identify these changes at early stages. It also gives profitability analysis a clear starting point.
Budget versus actual cost
This metric compares planned spending with actual spending. For example, a project may have a USD 40,000 budget. Actual costs could reach USD 46,000 before completion. That creates a USD 6,000 unfavorable variance. Regular variance reviews strengthen project finance decisions. They also reveal estimation gaps and uncontrolled scope changes.
Billable utilization
Billable utilization measures revenue-generating working time.
Utilization = Billable Hours ÷ Available Hours × 100
Low utilization can weaken project profitability. The business still carries resource costs during unused capacity. McKinsey has highlighted the connection in project-based services. One example showed planned utilization at 85%. Actual delivery utilization reached only 68%. The metric needs context, though. Different roles naturally have different utilization levels.
Project time management software can help capture those differences. It can also connect logged hours with project budgets.
Estimated versus actual hours
Hours often explain why project margins change. Compare the original estimate with actual delivery hours. Large gaps may indicate poor estimation or rework. They can also reveal scope expansion or inefficient allocation. Fixed-fee projects are especially sensitive to this variance. A project may generate the same revenue throughout delivery. Its cost can still rise with every additional hour. That makes hours an important input for profitability analysis.
Rate realization
Rate realization compares expected rates with actual earned rates.
Rate Realization = Actual Billing Rate ÷ Target Rate × 100
A lower result can expose unbilled work or discounts. It can also reveal excessive delivery hours. For example, an expected rate may be USD 150. The realized rate could fall to USD 120. That 20% gap directly affects project margins. Rate realization also matters for project finance. It connects pricing decisions with actual project outcomes.
Estimate at Completion
Estimate at Completion, or EAC, is an advanced theory. It answers one practical question:
What will this project cost when it finishes?
EAC combines actual costs with expected remaining costs. It gives leaders an advanced profitability view. This makes EAC valuable for project profitability. Teams can forecast problems before final delivery.
Revenue and cost variance
Revenue variance compares expected revenue with actual revenue. Cost variance compares expected costs with actual costs. Together, they provide a broader financial picture. This matters when scope changes during delivery. Unpriced scope can increase costs without increasing revenue. That can quickly damage project margins. It can also distort wider project finance reporting. Tracking both variances strengthens ongoing profitability analysis.
How do you measure project profitability during delivery?
Start with a financial baseline before work begins. Record expected revenue, hours, resources, costs, and expenses. Then, connect delivery data with financial data.
- Set the baseline: Record the approved project budget.
- Track actuals: Capture hours, expenses, resources, and billing.
- Compare results: Review planned and actual performance.
- Forecast outcomes: Update EAC and expected margins.
- Take action: Correct issues before project closure.
This process makes project profitability an active management measure. It also improves visibility across project finance activities. Resource and project management software can support this process. It connects resource plans with actual project activity. Project time management software adds another layer of visibility. It shows where planned hours differ from actual hours. The result is better profitability analysis across active projects.
How can you improve project profitability when margins fall?
Improving project profitability starts with finding the source. Do not treat every margin problem as a pricing issue.
Control resource costs
Match resource skills with project requirements. Avoid using expensive resources for routine work. Better resource allocation can protect project margins. It also strengthens resource planning and project finance forecasts.
Control unplanned hours
Review estimated and actual hours frequently. Flag major variances before they become expensive. Project time management software can support this process. It can capture billable and non-billable hours consistently.
Manage scope changes
Unapproved work can reduce project profitability. Track requested changes before additional work begins. A change should trigger scope and pricing discussions. This protects both delivery capacity and project margins.
Review performance regularly
Do not wait for project closure. Weekly reviews can reveal emerging financial issues. McKinsey has reported a 30% increase in project margins. That improvement followed reduced technician labor costs. The lesson is practical. Operational decisions can directly influence project finance outcomes.

Can project profitability software connect these metrics?
Project profitability software can bring delivery and financial data together. This reduces the need for separate manual calculations. Useful capabilities can include:
| Capability | Profitability Benefit |
| Time tracking | Shows actual delivery effort |
| Resource planning | Shows expected resource costs |
| Expense tracking | Captures project-specific spending |
| Budget monitoring | Highlights cost variance |
| Billing data | Connects work with revenue |
| Financial reporting | Supports profitability analysis |
Project profitability software becomes more useful when systems connect. That connection can improve project finance visibility. For professional services teams, professional services automation software can help. PSA software connects projects, resources, time, and financial information. Resource and project management software can support resource decisions.
It can also help teams monitor project capacity. Likewise, project time management software captures actual effort. That data supports more accurate project margin calculations. For teams comparing project profitability software, integration matters. Disconnected tools can recreate the same visibility problem.
What should businesses look for in project profitability software?
The right project profitability software should fit existing workflows. Replacing every system is not always necessary.
Look for systems that can connect:
- Project plans with resource assignments
- Timesheets with project budgets
- Expenses with project records
- Billing with delivery activity
- Finance data with project performance
This is where Procxo can fit into an existing environment. Procxo connects existing tools, ERPs, finance systems, and enterprise software. This connected approach can reduce duplicate data entry. It can improve financial visibility across project operations.
Teams can use PSA software alongside their existing systems. Professional services automation software can connect delivery and financial workflows. That makes project profitability software more useful beyond reporting. It can support decisions across delivery, billing, and finance.
FAQs
Calculate revenue minus total project costs. Then divide profit by project revenue. Track the result throughout delivery, not just afterward.
Start with gross margin and cost variance. Then track utilization, hours, rate realization, and EAC. These metrics provide both current and advanced visibility.
Scope creep is one common reason. Unplanned hours can also increase delivery costs. Poor resource allocation can further reduce project margins.
Project finance data connects project activity with financial outcomes. It can reveal cost overruns and billing gaps. It also supports stronger profitability analysis.
There is no universal margin target. Targets vary by industry, service, pricing, and cost structure. Businesses should compare results with their own benchmarks.
Not always. Smaller teams may manage simple projects manually. Complex projects benefit more from connected project profitability software.
PSA software connects project, resource, time, and financial data. It can improve visibility across active projects. That supports better project finance and margin decisions.

Latest Blogs

16th September, 2026